Tag Archives: sysadmin

Installing the VMware Horizon View Client on Ubuntu 14.10

If you’re a Linux user, you will be happy to know that VMware offers a Linux version of it’s Horizon View client. However, it’s a bit of a strange release strategy. For Ubuntu, my distro of choice, VMware only offers the packages for the LTS versions of the popular OS. This is kind of a bummer because the LTS versions of Ubuntu Linux are only released every 2 years. I really do not like running an OS that’s even one release behind.

Well, I decided this just cannot stand. I wanted to have a working View client on my latest Ubuntu 14.10 release which was not an LTS version.

Google was surprisingly unhelpful here, only really offering suggestions on installing a 32 bit version and changing repositories in your sources.list file. I did not really want to cross the streams that much on a fresh build, so I decided to try and find a cleaner way to get the Horizon View client installed. This was actually quite a bit easier than I expected.

The good news is, the packages VMware releases for the LTS versions of Ubuntu can pretty much install on any of the later versions of Ubuntu. Here’s how I did it:

  • Browse to http://archive.canonical.com/ubuntu/pool/partner/v/vmware-view-client/ from your web browser and download the latest .deb package file. At the time of this writing, the latest version is 2.2.0 for Ubuntu 14.04 LTS
  • Open the file with archive manager and click “Install”, or install it from command line via
    sudo dpkg -i vmware-view-client_2.2.0-0ubuntu0.14.04_i386.deb
  • The package should auto-resolve some dependencies for you and install successfully.

That’s it! You now have the VMware Horizon View client installed on the latest/greatest release of Ubuntu. It’s been working great for me, and I hope it works just as well for anyone who comes across this.

How to Build an Ikea “Lack Rack” for Your Home Lab

As a sysadmin, I keep in the loop with the home lab/hobbyist community and am always looking for cool things to try and do with computers. One of the projects I’ve been looking to take on for some time has been a rack to store my IT equipment. Granted, I don’t have a ton – a decent server, small NAS, and some other miscellaneous hardware – but having all this stuff just sitting on the floor of my utility room is not ideal by any means.

Through online forums and /r/homelab on reddit, I came up with a game plan to do this on the cheap.

Enter the Lack Rack.

Somehow, it was discovered that Ikea’s lack table line provides a near perfect fit for rack-sized hardware. There is a decent amount of information out there if you’re Googling around for how to build one (Even a whole site dedicated to them). But, most of what I found out there was using a side table with legs only. Kind of like this:

I didn’t really love that style.  It looks and feels half done to me.  So, I decided to take it a little bit further.  I used 2 lack tables since they’re so cheap which allowed me to give it a base.  Then I wanted to be able to wheel it around, so I also added some caster style wheels on the bottom as well.  Here are a couple pics of what I ended up with

I haven’t really seen any good writeups with doing a lack rack in this style, and therefore I wanted to go ahead and share my experiences with the interenet.

Here’s how I made my lack rack

What to get:

  • 2x Ikea Lack Side tables.  I recommend 22 inch version vs. the 21 and 5/8 that seem to be on other guides. This is a perfect/snug fit.  I can’t imagine a 21 and 5/8 table fitting my server without me having to bump the legs out a little bit.  Note that it seems the black table is the only one that comes in 22”
  • If you want to be able to roll this rig, get 4 caster style wheels that you can easily screw onto the bottom
  • Some hardware.  You’ll need at least 4 of something like  these corner brace/angle bracket things, as well as some self-drilling style screws to mount those and your wheels.  I recommend taking some time looking at the screw width, depth, and length.  These are Ikea tables after all, so you have to sort of balance out how hard you tighten them down while being careful not to strip it out.  I didn’t have any problems using some screws with pretty wide threads that bit into the wood fairly well.  You should need 24 screws if you’re doing wheels and braces.
  • Optional:  A couple of these rails to set your gear on!  I haven’t done this yet, and I’m not sure if I will.  But you might want to line the sides of your lack rack with these.

    The Assembly Steps:

  • Gather your 2x Ikea Lack side tables (again, I am a fan of the black 22” version).
  • Assemble the first table completely per the provided instructions.  It’s very easy…  You essentially just have to hand screw the legs onto the top.
  • Open the 2nd table and take just the top, which you will actually use as the bottom of your rack.  This shall henceforth be referred to as the “base”.  You’ll have 4 legs left over. Find something creative to use them for?
  • Using the angle bracket/corner brace things, attach your first fully assembled table to the base of the 2nd table.  It might sound a little complicated, but you really just set the base from your 2nd table down flat with the finished side up, and then set your fully assembled table on top of it.  I did not pre-drill any holes and they all screwed in very easily without stripping.  It’s worth mentioning again that it did feel like it’d be easy to strip the wood, so don’t over tighten.
  • Reminder, finished side of the base goes up.  You don’t want the bottom of your rack decorated while the visible base section is unfinished wood.  You can see from my pictures how the top/bottom are oriented and the way I used the brackets to mount the tables together.
  • You should now have a mostly fully functioning “lack rack” – Congratulations!  Now if you like, go ahead and flip it upside down and screw on your caster style wheels to the bottom.
  • And there you go, you should be all set.

I might find a way to add some sides to this build to clean it up a little bit.  It also could use some cable management.  And as I stated earlier I may end up putting some rails along the sides.  I’ll call this my stage 1 for a decent home lab lack rack.  Total cost?  About 35 dollars.  Hope this helps if you’re considering a build!

Getting Started on Centralized Logging with Logstash, Elasticsearch and Kibana

As a sysadmin, one of the “rainy day” things on my to-do list for some time has been exploring centralized logging.  I’ve done a few proof of concept style quick implementations throughout the years but have never been able to secure budget or resources to see it to completion.  Splunk was too expensive, and the open source ones I tried required too much effort to be worth while back then.  This time, however,  I was more determined to make something stick.  With that, I began searching out some of the more popular open source tools.

I considered various combinations of things like Fluentd, Graylog2, Octopussy, etc.  In the end, I settled on going with the Logstash/Elasticsearch/Kibana stack.  All of these free, open source tools are powerful in their own right – but they’re designed to work together and are immensely powerful when combined.  Logstash collects, ships, filters, and makes logs consistent.  Elasticsearch creates indices and searchability of the logs.  And finally, Kibana gives you a great web interface to analyze all your log data.  Here’s a screenshot of it all coming together for me.  This is a custom Kibana dashboard showing syslog output from all my VMware servers:
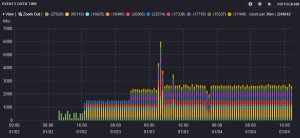
Custom-Kibana-dashboard

Before diving into the steps, I feel the need to point out that I’ve had a great time learning and setting up these tools.  I honestly haven’t been this excited about using software since first trying VMware ESX server.   I can’t stop working on it.  It’s become an addiction for me to continuously improve, filter, and make sense of various logs.  It’s really very rewarding to be able to visualize your log data in such a usable way.  Everything was  pretty easy to set up at a basic level, and the open source community was there for me via #logstash on IRC when I needed help taking things further or had any questions.  The setup of these tools can feel a little daunting to a newcomer with so many options and such a degree of configurability/customization, so I wanted to provide a step-by-step guide for how I ended up with an initial deployment.

A couple prerequisite disclaimer points before I get started

  • I chose to use Ubuntu server.  This is a personal preference, and certainly this guide can be helpful if you choose a different OS.  Use whatever OS you feel comfortable with.
  • For the purposes of this guide, all 3 tools will be run on one server.  It is possible (even recommended depending on your workload) to separate them onto different servers.
  • This is a “getting started” guide.  These tools can certainly be taken much further than I take them here.  They can be integrated with a message broker like Redis or RabbitMQ.  I’ll consider going into deeper options such as these in a followup enhanced configuration guide vs. here in the getting started guide.

Now  let’s get into the setup!

  1. Get a webserver and PHP installed on your server.  I much prefer apache or nginx as the webserver.  Logstash does has a built in webserver that you can run, but I much prefer running a separate webserver.  In Ubuntu, I just went with the entire LAMP stack.   This is as easy as “apt-get install lamp-server“.
  2. Install a java runtime.  Again, easy in Ubuntu via apt-get install openjdk-7-jre-headless
  3. Download the three components.  I downloaded gzip archives of each, but depending on your OS, there may be packages built for it.  Choose whichever way you’re more comfortable with.
  4. Extract the archives (tar -xvf <filename>.tgz) and place the files where you want them. I chose /opt for logstash and elasticsearch, and then Kibana goes in your web root.  I did it as follows, an;d I’ll continue to reference these directories in the rest of the guide.
    • Extracted Elasticsearch tgz to /opt/elasticsearch
    • Placed the Logstash jar in /opt/logstash
    • Extracted Kibana tgz to my web root folder, /var/www/kibana – there was no special configuration needed other than putting the files here.
  5. Edit your Elasticsearch config file (/opt/elasticsearch/config/elasticsearch.yml) and make 2 edits:
    • Find the line that says “cluster.name” and uncomment it, setting a name for your new Elasticsearch cluster.
    • Look for “node.name” and set the node name as well.
    • Note that you don’t have to set these variables.  If you don’t set these, Elasticsearch will set them randomly for you, but it is handy to know which server you’re looking at if you ever have to expand your setup so I recommend setting them.
  6. Go ahead and start Elasticsearch by running /opt/elasticsearch/bin/elasticsearch
  7. Create a basic logstash.conf file.  I created an /opt/logstash/logstash.conf with an initial config something like this, which just creates local file inputs.
    input {
    file {
    type => "linux-syslog"
    path => [ "/var/log/*.log", "/var/log/messages", "/var/log/syslog" ]
    }
    }
    output {
    stdout { }
    elasticsearch { cluster => "YourclusterName" }
    }

    This input section is defined to look at and ingest files defined in the path array variable. Then the output section is setting to output to stdout (your command window) and also to elasticsearch where you define your cluster name. This is a very basic config to easily show us things are working.

  8. Now fire up Logstash by running:  /opt/logstash/bin/logstash agent -f /opt/logstash/logstash.conf
  9. You should now see logstash initialize and all of the events it indexes should get output to your terminal via the stdout output, in addition to getting pushed over to elasticsearch where we should see them with Kibana.
  10. If you extracted Kibana as noted in step 4, then you should be able to browse to your server and check out your data!  Try http://yourserver/kibana and you should be greeted with an introduction screen. You’ll see they have a pre-configured logstash dashboard that you can click on and save as your default
  11. Once you see your data is indeed visible through Kibana, we can dive into further configuration of logstash.  If something’s off and you don’t see data, check out the logstash docs or jump into #logstash on irc.freenode.net where people are very happy to help.  Once you’re satisfied that it is working, you may want to remove the stdout line from the output section and only have your output go to Elasticsearch for indexing.
  12. Now that we know things are functional, we can set up some additional logstash configs to further improve things
    • First, let’s set up a very common input for remote systems to dump syslogs into Logstash
    • Edit your logstash.conf again and add a syslog to your input section like this:
      syslog {
      type => "syslog"
      }
    • With the Logstash syslog input, you can specify the port, add tags, and set a bunch of other options. Make sure to check out the documentation for each input you add to your config. For syslog, visit http://logstash.net/docs/1.3.2/inputs/syslog for example.
    • Next, we’ll want to set up a filter section of our config. The filter below makes sure we get a FQDN for the host by using a reverse DNS lookup and replacing the host variable with that (without this, many hosts just report an IP address), and then additionally adds a tag “VMware” for any host matching “esx” in the hostname. Pending your host names contain “esx” somewhere in them, this example makes it easy for browsing VMware syslog data through Kibana. You can certainly tailor these to any host names or even other fields you like. Logstash’s filtering and grok parsing are very powerful capabilities. This example is enough to give you an idea of the structure and how the logic works. Again, I can’t stress enough to dig into the docs and hop on IRC for help.  Overall, the filter section is probably where you’ll end up spending most of your time.
      filter {
      if [type] == "syslog" {
      dns {
      reverse => [ "host" ] action => "replace"
      }
      if [host] =~ /.*?(esx).*?(yourdomain)?/ {
      mutate { add_tag => [ "VMware" ] }
      }
      }
      }
    • Once you get your logstash.conf tweaked, restart Logstash.  ps -ef | grep logstash and then kill the process.  Restart it the same way you did in step 8.
  13. Now we’re ready to have some servers to dump syslogs to your new central log server! I started with VMware and Ubuntu and branched out from there. Depending on your OS or the syslog implementation, the method of sending logs to a remote syslog host varies.  Check your OS documentation for how to do this.  The default port is 514, which is default for the syslog input and typically remote hosts sending syslog data.
  14. Check out Kibana now and hopefully you see log entries.  Click through on hosts, on tags, try creating a new dashboard displaying only your “VMware” tagged logs. Etc Etc Etc – hopefully you can see your filters in action and how it helps bring consistency to your log data.
  15. Keep exploring the Logstash docs for more inputs.  Windows servers, Cisco devices, apache or IIS logs, Exchange, etc.  I don’t think there’s a sysadmin out there who has a shortage of log data they could/should be analyzing.
  16. Document your setup as you go so you can remember it later. 🙂

I hope this startup guide has been helpful to getting a base configuration.  Keep in mind that Logstash has a plethora of inputs, outputs codecs and filters.  Make sure to check out all the documentation at http://logstash.net/docs/1.3.2/ and tailor this awesome tool to your needs.  If you have a system logging, chances are there’s an input or plugin for it.

A few bonus tips

  • Check out http://www.elasticsearch.org/videos/, particularly “Introduction to Logstash”
  • Install a few awesome plugins for Elasticsearch
    • /opt/elasticsearch/bin/plugin -install karmi/elasticsearch-paramedic
    • /opt/elasticsearch/bin/plugin -install royrusso/elasticsearch-HQ
    • /opt/elasticsearch/bin/plugin -install mobz/elasticsearch-head
  • Move your logstash dashboard to default by browsing to /var/www/kibana/app/dashboards and copying logstash.json to default.json.  Maybe save default.json off as default.json.orig or something first.
  • Make sure to visit the Logstash community cookbook.

Building a Serviceguard Cluster on HP-UX 11.31

I have recently been working alot with HP-UX.  A big part of that work relates to managing Serviceguard clusters, something I have had little previous experience doing.  It was a challenge for me to find any sort of a quick start guide or simplified steps towards building a Serviceguard cluster, so I wanted to combine all the pieces and parts I have Googled and man-paged together so the next person can hopefully find this useful.

Prerequisites

  • Two hosts (nodes) running the same build of HP-UX
  • Same version of Serviceguard installed

Here are the steps to build a ServiceGuard cluster on HP-UX 11.31

  1. Run csshsetup <secondary nodename> on your primary node, enter the root password.
  2. Run csshsetup <primary nodename> on your secondary node, enter the root password.
  3. Run cmpreparecl -n <primarynode> -n <secondarynode> to set up the Serviceguard relationship settings
  4. Create a basic cluster configuration file by running cmquerycl -v -C <clustername.ascii> -n <primarynode> -n <secondarynode>
  5. Edit the newly created ascii file to your specific needs, noting things like:
    • Cluster name
    • IPs
    • Quorum server hosts or volume group
    • Cluster shares storage/volume groups
    • Take some extra time here, this is really important!
  6. Validate the cluster config file by running cmcheckconf -C <clustername.ascii>.  Deal with any warnings or errors that are of concern.  (The setup will apply with warnings, but they should still be considered)
  7. Apply the config and create the cluster by running cmapplyconf -v -C <clustername.ascii>.
  8. Review all the output and make sure the cluster relationship was successful; run cmviewcl which should show both nodes, likely in a “down” state
  9. You can bring up the nodes now if you want, starting with the primary node by running cmrunnode <nodename>. Run cmviewcl again to check and make sure everything looks good.  You’ll see a cluster, and nodes but no packages yet
  10. Now its time to create some packages.  This is where the real meat of Serviceguard starts to develop, so pay special attention to these configurations
    • You can create a very basic template config by running cmmakepkg -m sg/failover -m sg/package_ip <packageconfig.conf> – which would give you failover and IP capabilities
    • Or, you could create a “full” config by running cmmakepkg -m sg/all <packageconfig.conf>.
    • Edit the package config file to suit your needs, consider adding: IP Addresses, package names, filesystems and volume groups
  11. When you’ve got your package config file in order, you can validate it by running cmcheckconf -v -P <packageconfig.conf>.
  12. Review your output and check for any errors.  If you’re satisfied with everything, go ahead and apply the config to create your cluster package!  cmapplyconf -P <packageconfig.conf>
  13. Run a cmviewcl again to check out the cluster now, you should see your newly created cluster package, in a down state.
  14. To  bring the package online, run cmrunpkg -n <nodename> <packagename> and then make sure it is up and running (with another cmviewcl)
  15. Optionally, you can set the package up for auto run by cmmodpkg -e <packagename> to allow it to startup automatically after a failover.

You can also use the HP systems management homepage to click through the steps of creating a Serviceguard cluster, but really where’s the fun in that? 🙂

A list of some of the useful commands to use for Serviceguard clusters:

  • cmviewcl
  • cmquerycl
  • cmrunpkg
  • cmhaltpkg
  • cmrunnode
  • cmcheckconf
  • cmapplyconf
  • cmmakepkg